


AVERAGE
Provides an estimate of the mean or expected value of the data. To use it, supply the range
of data you want the average of “=AVERAGE(data range).” For example, if you wanted the
average of the observations of the data in cells A1 through A10, you might enter
=AVERAGE (A1:A10) into cell A12.
MEDIAN
Returns the median or 50th percentile of the data. To use it, supply the range of data you
want the median of “=MEDIAN (data range).”
TRIMMEAN
Computing a trimmed mean is a way to temper the influence of extreme values in the estimate. A trimmed mean excludes k% of the data from the calculation, where k is a judgmentally selected proportion of the data to exclude. The calculation excludes the k/2% highest and lowest values. To use, supply the range of data you want the trimmed mean of
and specify the proportion to exclude. The proportion must be between zero and one
“=TRIMMEAN(data range, proportion).”
GEOMEAN
The geometric mean is a measure that is often used for data that are expressed as rates of change (such as the return on stocks or other investments). In a sample of size n, it returns the nth root of the product of all n sample items and is particularly relevant for data that follow the logNormal distribution. “=GEOMEAN(data range)”.
WEIGHTED AVERAGES
Actuaries often used weighted averages rather than arithmetic averages. For instance, it is common to compute weighted average loss development factors. The rational behind a weighted average is to produce a more stable estimate than can be obtained from an unweighted average. When using a weighted average, a common practice is to select a weightfor an observation that is believed to be inversely proportional to its variance so that
observations contributing more variability to the estimate are given less weight.
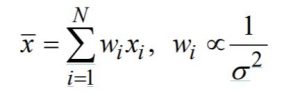
For instance when computing average severities for a given accident period and development age, those severities based on cells with higher claim volumes will be more stable than the severities based on cells with lower claim volumes. It therefore makes sense to give more weight to the cells with larger claim volumes when fitting a severity model using the data. This can be accomplished by using claim count as the weight variable. Excel does not have a function that can be used to compute weighted averages. However
certain functions are helpful when computing weighted averages:
SUMPRODUCT
Computes the product of two columns or rows. If one of the columns is the weight associated with each observation and the other is the sample values, the weighted average can be computed.
“=SUMPRODUCT(weight variable range, sample value variable range)”
gives the same result as creating a column that is the product of the column with the first variable times the column with the second variable, and then summing the result. Dividing the SUMPRODUCT by the SUM of the weight variable range results in the weighted average.
SUMIF
Calculates a conditional sum for the values in sum range which met the specified criteria using “=SUMIF(criterion range, criterion, sum range).”
For instance, if you wish to sum only the losses at 12 months of maturity for which there also losses at 24 months of maturity (i.e., drop the most recent period from the sum), using the criterion “>0”, along with specification of the 24 month values as the criterion range and the 12 month values as the sum range will accomplish this.