


Studies show that humans respond to visuals better than any other type of stimuli. The human brain processes visual information 60,000 times faster than text. In fact, visual data accounts for 90 percent of the information transmitted to the brain.
Today’s businesses have access to a vast amount of data generated from both inside and outside the organization. Data visualization helps you make sense of it all. It enables you to look at data differently to discover new answers and insights by:
- Tell a Visual Data Story
Go beyond simply presenting numbers and facts. Capture insights as visual stories. Build narratives around your data so that its relevance is clearly communicated and easy to understand. - Recognize the Signals from the Noise
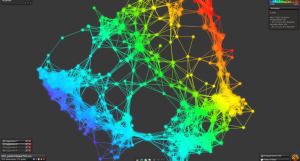
A picture really is worth a thousand words. A single graph conveys complex issues far more clearly—and enables users to identify outliers and anomalies much faster. - Master a Growing Volume of Data
The digital universe is expected to double in size every two years. But you don’t have to be overwhelmed. By transforming data into simple visuals, it becomes more meaningful to decision-makers. Visual interaction with large datasets simplifies the analytic process, revealing new business insights that can be turned into a competitive advantage.